Health #
Starting with v4.8.0, Dependency-Track exposes health information according to the MicroProfile Health specification. Refer to the specification for details on how the exposed endpoints behave (i.e. MicroProfile Health REST interfaces specifications).
Currently, only a single readiness check is included. The database check verifies that database connections can be acquired and used successfully. The check spans both connection pools (see Connection Pooling).
{
    "status": "UP",
    "checks": [
        {
            "name": "database",
            "status": "UP",
            "data": {
                "nontx_connection_pool": "UP",
                "tx_connection_pool": "UP"
            }
        }
    ]
}
Logging #
Logging of the API server is configured via Logback. All distributions of the API server ship with a default Logback configuration. It defines the following behavior:
- Log messages from the embedded Jetty server to:
$HOME/.dependency-track/server.<NUMBER>.log
- Log messages from Dependency-Track and the underlying Alpine framework to:
$HOME/.dependency-track/dependency-track.<NUMBER>.log- Standard Output
- Log security-related messages to:
$HOME/.dependency-track/dependency-track-audit.<NUMBER>.log- Standard Output
- For log files:
- Create a new log file once the current one exceeds 10MB in size
- Retain a history of up to 9 files per log before overwriting them
- Output logs in a human-friendly format
For containerized deployments,
$HOMEwill refer to the/datadirectory.
Custom Logging Configuration
When operating Dependency-Track in container-centric environments, where logs are typically forwarded from containers’ standard output to a centralized log aggregator (e.g. ElasticSearch, OpenSearch, Splunk), it is desirable to disable logging to disk, and even change the output to a more machine-readable format.
Starting with Dependency-Track v4.9.0, it is possible to provide a custom Logback configuration, and configure JSON as output format (powered by logstash-logback-encoder).
An example configuration file for JSON logging to standard output (logback-json.xml) is included
in the API server container image, and can be enabled using the LOGGING_CONFIG_PATH environment variable:
# (Other configuration options omitted for brevity)
docker run -it --rm \
  -e "LOGGING_CONFIG_PATH=logback-json.xml" \
  dependencytrack/apiserver:latest
Refer to the logstash-logback-encoder documentation for advanced customization details.
In order to use a truly custom configuration file, it has to be mounted into the container, e.g.:
# (Other configuration options omitted for brevity)
docker run -it --rm \
  -v "./path/to/logback-custom.xml:/etc/dtrack/logback-custom.xml:ro" \
  -e "LOGGING_CONFIG_PATH=/etc/dtrack/logback-custom.xml" \
  dependencytrack/apiserver:latest
For non-containerized distributions of the API server, a custom configuration file may be provided
via the logback.configurationFile JVM property:
# (Other configuration options omitted for brevity)
java -Dlogback.configurationFile=/path/to/logback-custom.xml \
  -jar dependency-track-apiserver.jar
Metrics #
The API server can be configured to expose system metrics via the Prometheus text-based exposition format. They can then be collected and visualized using tools like Prometheus and Grafana. Especially for containerized deployments where directly attaching to the underlying Java Virtual Machine (JVM) is not possible, monitoring system metrics via Prometheus is crucial for observability.
System metrics are not the same as portfolio metrics exposed via
/api/v1/metricsREST API or the web UI. The metrics described here are of technical nature and meant for monitoring the application itself, not the data managed by it. If exposition of portfolio statistics via Prometheus is desired, refer to community integrations like Jetstack’s dependency-track-exporter.
To enable metrics exposition, set the alpine.metrics.enabled property to true (see Configuration).
Metrics will be exposed in the /metrics endpoint, and can optionally be protected using
basic authentication via alpine.metrics.auth.username and alpine.metrics.auth.password.
Exposed Metrics
Exposed metrics include various general purpose system and JVM statistics (CPU and Heap usage, thread states, garbage collector activity etc.), but also some related to Dependency-Track’s internal event and notification system. More metrics covering other areas of Dependency-Track will be added in future versions.
Database
Metrics of the ORM used by the Dependency-Track API server are exposed under the datanucleus namespace.
They provide a high-level overview of how many, and which kind of persistence operations are performed:
# HELP datanucleus_transactions_rolledback_total Total number of rolled-back transactions
# TYPE datanucleus_transactions_rolledback_total counter
datanucleus_transactions_rolledback_total 0.0
# HELP datanucleus_queries_failed_total Total number of queries that completed with an error
# TYPE datanucleus_queries_failed_total counter
datanucleus_queries_failed_total 0.0
# HELP datanucleus_query_execution_time_ms_avg Average query execution time in milliseconds
# TYPE datanucleus_query_execution_time_ms_avg gauge
datanucleus_query_execution_time_ms_avg 0.0
# HELP datanucleus_transaction_execution_time_ms_avg Average transaction execution time in milliseconds
# TYPE datanucleus_transaction_execution_time_ms_avg gauge
datanucleus_transaction_execution_time_ms_avg 77.0
# HELP datanucleus_datastore_reads_total Total number of read operations from the datastore
# TYPE datanucleus_datastore_reads_total counter
datanucleus_datastore_reads_total 5650.0
# HELP datanucleus_datastore_writes_total Total number of write operations to the datastore
# TYPE datanucleus_datastore_writes_total counter
datanucleus_datastore_writes_total 1045.0
# HELP datanucleus_object_deletes_total Total number of objects deleted from the datastore
# TYPE datanucleus_object_deletes_total counter
datanucleus_object_deletes_total 0.0
# HELP datanucleus_transactions_total Total number of transactions
# TYPE datanucleus_transactions_total counter
datanucleus_transactions_total 1107.0
# HELP datanucleus_queries_active Number of currently active queries
# TYPE datanucleus_queries_active gauge
datanucleus_queries_active 0.0
# HELP datanucleus_queries_executed_total Total number of executed queries
# TYPE datanucleus_queries_executed_total counter
datanucleus_queries_executed_total 4095.0
# HELP datanucleus_connections_active Number of currently active managed datastore connections
# TYPE datanucleus_connections_active gauge
datanucleus_connections_active 0.0
# HELP datanucleus_object_inserts_total Total number of objects inserted into the datastore
# TYPE datanucleus_object_inserts_total counter
datanucleus_object_inserts_total 6.0
# HELP datanucleus_object_fetches_total Total number of objects fetched from the datastore
# TYPE datanucleus_object_fetches_total counter
datanucleus_object_fetches_total 981.0
# HELP datanucleus_transactions_active_total Number of currently active transactions
# TYPE datanucleus_transactions_active_total counter
datanucleus_transactions_active_total 0.0
# HELP datanucleus_object_updates_total Total number of objects updated in the datastore
# TYPE datanucleus_object_updates_total counter
datanucleus_object_updates_total 1039.0
# HELP datanucleus_transactions_committed_total Total number of committed transactions
# TYPE datanucleus_transactions_committed_total counter
datanucleus_transactions_committed_total 1107.0
Additionally, metrics about the database connection pools are exposed under the hikaricp namespace.
Monitoring these metrics is essential for tweaking the connection pool configuration (see Connection Pooling):
# HELP hikaricp_connections Total connections
# TYPE hikaricp_connections gauge
hikaricp_connections{pool="non-transactional",} 13.0
hikaricp_connections{pool="transactional",} 12.0
# HELP hikaricp_connections_usage_seconds Connection usage time
# TYPE hikaricp_connections_usage_seconds summary
hikaricp_connections_usage_seconds_count{pool="non-transactional",} 5888.0
hikaricp_connections_usage_seconds_sum{pool="non-transactional",} 60.928
hikaricp_connections_usage_seconds_count{pool="transactional",} 138.0
hikaricp_connections_usage_seconds_sum{pool="transactional",} 0.036
# HELP hikaricp_connections_usage_seconds_max Connection usage time
# TYPE hikaricp_connections_usage_seconds_max gauge
hikaricp_connections_usage_seconds_max{pool="non-transactional",} 1.319
hikaricp_connections_usage_seconds_max{pool="transactional",} 0.007
# HELP hikaricp_connections_min Min connections
# TYPE hikaricp_connections_min gauge
hikaricp_connections_min{pool="non-transactional",} 10.0
hikaricp_connections_min{pool="transactional",} 10.0
# HELP hikaricp_connections_pending Pending threads
# TYPE hikaricp_connections_pending gauge
hikaricp_connections_pending{pool="non-transactional",} 0.0
hikaricp_connections_pending{pool="transactional",} 0.0
# HELP hikaricp_connections_idle Idle connections
# TYPE hikaricp_connections_idle gauge
hikaricp_connections_idle{pool="non-transactional",} 13.0
hikaricp_connections_idle{pool="transactional",} 12.0
# HELP hikaricp_connections_timeout_total Connection timeout total count
# TYPE hikaricp_connections_timeout_total counter
hikaricp_connections_timeout_total{pool="non-transactional",} 0.0
hikaricp_connections_timeout_total{pool="transactional",} 0.0
# HELP hikaricp_connections_creation_seconds_max Connection creation time
# TYPE hikaricp_connections_creation_seconds_max gauge
hikaricp_connections_creation_seconds_max{pool="non-transactional",} 0.0
hikaricp_connections_creation_seconds_max{pool="transactional",} 0.0
# HELP hikaricp_connections_creation_seconds Connection creation time
# TYPE hikaricp_connections_creation_seconds summary
hikaricp_connections_creation_seconds_count{pool="non-transactional",} 12.0
hikaricp_connections_creation_seconds_sum{pool="non-transactional",} 0.0
hikaricp_connections_creation_seconds_count{pool="transactional",} 11.0
hikaricp_connections_creation_seconds_sum{pool="transactional",} 0.0
# HELP hikaricp_connections_active Active connections
# TYPE hikaricp_connections_active gauge
hikaricp_connections_active{pool="non-transactional",} 0.0
hikaricp_connections_active{pool="transactional",} 0.0
# HELP hikaricp_connections_max Max connections
# TYPE hikaricp_connections_max gauge
hikaricp_connections_max{pool="non-transactional",} 20.0
hikaricp_connections_max{pool="transactional",} 20.0
# HELP hikaricp_connections_acquire_seconds Connection acquire time
# TYPE hikaricp_connections_acquire_seconds summary
hikaricp_connections_acquire_seconds_count{pool="non-transactional",} 5888.0
hikaricp_connections_acquire_seconds_sum{pool="non-transactional",} 0.009996981
hikaricp_connections_acquire_seconds_count{pool="transactional",} 138.0
hikaricp_connections_acquire_seconds_sum{pool="transactional",} 4.68092E-4
# HELP hikaricp_connections_acquire_seconds_max Connection acquire time
# TYPE hikaricp_connections_acquire_seconds_max gauge
hikaricp_connections_acquire_seconds_max{pool="non-transactional",} 1.41889E-4
hikaricp_connections_acquire_seconds_max{pool="transactional",} 1.77837E-4
Event and Notification System
Event and notification metrics include the following:
# HELP alpine_events_published_total Total number of published events
# TYPE alpine_events_published_total counter
alpine_events_published_total{event="<EVENT_CLASS_NAME>",publisher="<PUBLISHER_CLASS_NAME>",} 1.0
# HELP alpine_notifications_published_total Total number of published notifications
# TYPE alpine_notifications_published_total counter
alpine_notifications_published_total{group="<NOTIFICATION_GROUP>",level="<NOTIFICATION_LEVEL>",scope="<NOTIFICATION_SCOPE>",} 1.0
# HELP alpine_event_processing_seconds
# TYPE alpine_event_processing_seconds summary
alpine_event_processing_seconds_count{event="<EVENT_NAME>",subscriber="<SUBSCRIBER_NAME>",} 1.0
alpine_event_processing_seconds_sum{event="<EVENT_NAME>",subscriber="<SUBSCRIBER_NAME>",} 0.047599797
# HELP alpine_event_processing_seconds_max
# TYPE alpine_event_processing_seconds_max gauge
alpine_event_processing_seconds_max{event="<EVENT_NAME>",subscriber="<SUBSCRIBER_NAME>",} 0.047599797
alpine_notifications_published_totalwill report all notifications, not only those for which an alert has been configured.
Events and notifications are processed by executors. The executor Alpine-EventService corresponds to what is typically referred to as worker pool, and is responsible for executing the majority of events in Dependency-Track. Alpine-SingleThreadedEventService is a dedicated executor for events that can’t safely be executed in parallel. The SnykAnalysisTask executor is used to perform API requests to Snyk (if enabled) in parallel, in order to work around the missing batch functionality in Snyk’s REST API. The following executor metrics are available:
# HELP executor_pool_max_threads The maximum allowed number of threads in the pool
# TYPE executor_pool_max_threads gauge
executor_pool_max_threads{name="Alpine-NotificationService",} 4.0
executor_pool_max_threads{name="Alpine-SingleThreadedEventService",} 1.0
executor_pool_max_threads{name="Alpine-EventService",} 40.0
executor_pool_max_threads{name="SnykAnalysisTask",} 10.0
# HELP executor_pool_core_threads The core number of threads for the pool
# TYPE executor_pool_core_threads gauge
executor_pool_core_threads{name="Alpine-NotificationService",} 4.0
executor_pool_core_threads{name="Alpine-SingleThreadedEventService",} 1.0
executor_pool_core_threads{name="Alpine-EventService",} 40.0
executor_pool_core_threads{name="SnykAnalysisTask",} 10.0
# HELP executor_pool_size_threads The current number of threads in the pool
# TYPE executor_pool_size_threads gauge
executor_pool_size_threads{name="Alpine-NotificationService",} 0.0
executor_pool_size_threads{name="Alpine-SingleThreadedEventService",} 1.0
executor_pool_size_threads{name="Alpine-EventService",} 7.0
executor_pool_size_threads{name="SnykAnalysisTask",} 10.0
# HELP executor_active_threads The approximate number of threads that are actively executing tasks
# TYPE executor_active_threads gauge
executor_active_threads{name="Alpine-NotificationService",} 0.0
executor_active_threads{name="Alpine-SingleThreadedEventService",} 1.0
executor_active_threads{name="Alpine-EventService",} 2.0
executor_active_threads{name="SnykAnalysisTask",} 0.0
# HELP executor_completed_tasks_total The approximate total number of tasks that have completed execution
# TYPE executor_completed_tasks_total counter
executor_completed_tasks_total{name="Alpine-NotificationService",} 0.0
executor_completed_tasks_total{name="Alpine-SingleThreadedEventService",} 0.0
executor_completed_tasks_total{name="Alpine-EventService",} 5.0
executor_completed_tasks_total{name="SnykAnalysisTask",} 132.0
# HELP executor_queued_tasks The approximate number of tasks that are queued for execution
# TYPE executor_queued_tasks gauge
executor_queued_tasks{name="Alpine-NotificationService",} 0.0
executor_queued_tasks{name="Alpine-SingleThreadedEventService",} 160269.0
executor_queued_tasks{name="Alpine-EventService",} 0.0
executor_queued_tasks{name="SnykAnalysisTask",} 0.0
# HELP executor_queue_remaining_tasks The number of additional elements that this queue can ideally accept without blocking
# TYPE executor_queue_remaining_tasks gauge
executor_queue_remaining_tasks{name="Alpine-NotificationService",} 2.147483647E9
executor_queue_remaining_tasks{name="Alpine-SingleThreadedEventService",} 2.147323378E9
executor_queue_remaining_tasks{name="Alpine-EventService",} 2.147483647E9
executor_queue_remaining_tasks{name="SnykAnalysisTask",} 2.147483647E9
Executor metrics are a good way to monitor how busy an API server instance is, and how good of a job it’s
doing keeping up with the work it’s being exposed to. For example, a constantly maxed-out executor_active_threads
value combined with a high number of executor_queued_tasks may indicate that the configured alpine.worker.pool.size
is too small for the workload at hand.
Search Indexes
# HELP search_index_ram_used_bytes Memory usage of the index in bytes
# TYPE search_index_ram_used_bytes gauge
search_index_ram_used_bytes{index="<INDEX_NAME>",} 0.0
# HELP search_index_docs_ram_total_objects Number of documents currently buffered in RAM
# TYPE search_index_docs_ram_total_objects gauge
search_index_docs_ram_total_objects{index="<INDEX_NAME>",} 0.0
# HELP search_index_docs_total_objects Number of docs in this index, including docs not yet flushed (still in the RAM buffer), and including deletions
# TYPE search_index_docs_total_objects gauge
search_index_docs_total_objects{index="<INDEX_NAME>",} 0.0
# HELP search_index_operations_total Total number of index operations
# TYPE search_index_operations_total counter
search_index_operations_total{index="<INDEX_NAME>",operation="<OPERATION>",} 0.0
Retries
Dependency-Track will occasionally retry requests to external services. Metrics about this behavior are exposed in the following format:
resilience4j_retry_calls_total{kind="successful_with_retry",name="snyk-api",} 42.0
resilience4j_retry_calls_total{kind="failed_without_retry",name="snyk-api",} 0.0
resilience4j_retry_calls_total{kind="failed_with_retry",name="snyk-api",} 0.0
resilience4j_retry_calls_total{kind="successful_without_retry",name="snyk-api",} 9014.0
Where name describes the remote endpoint that Dependency-Track uses retries for.
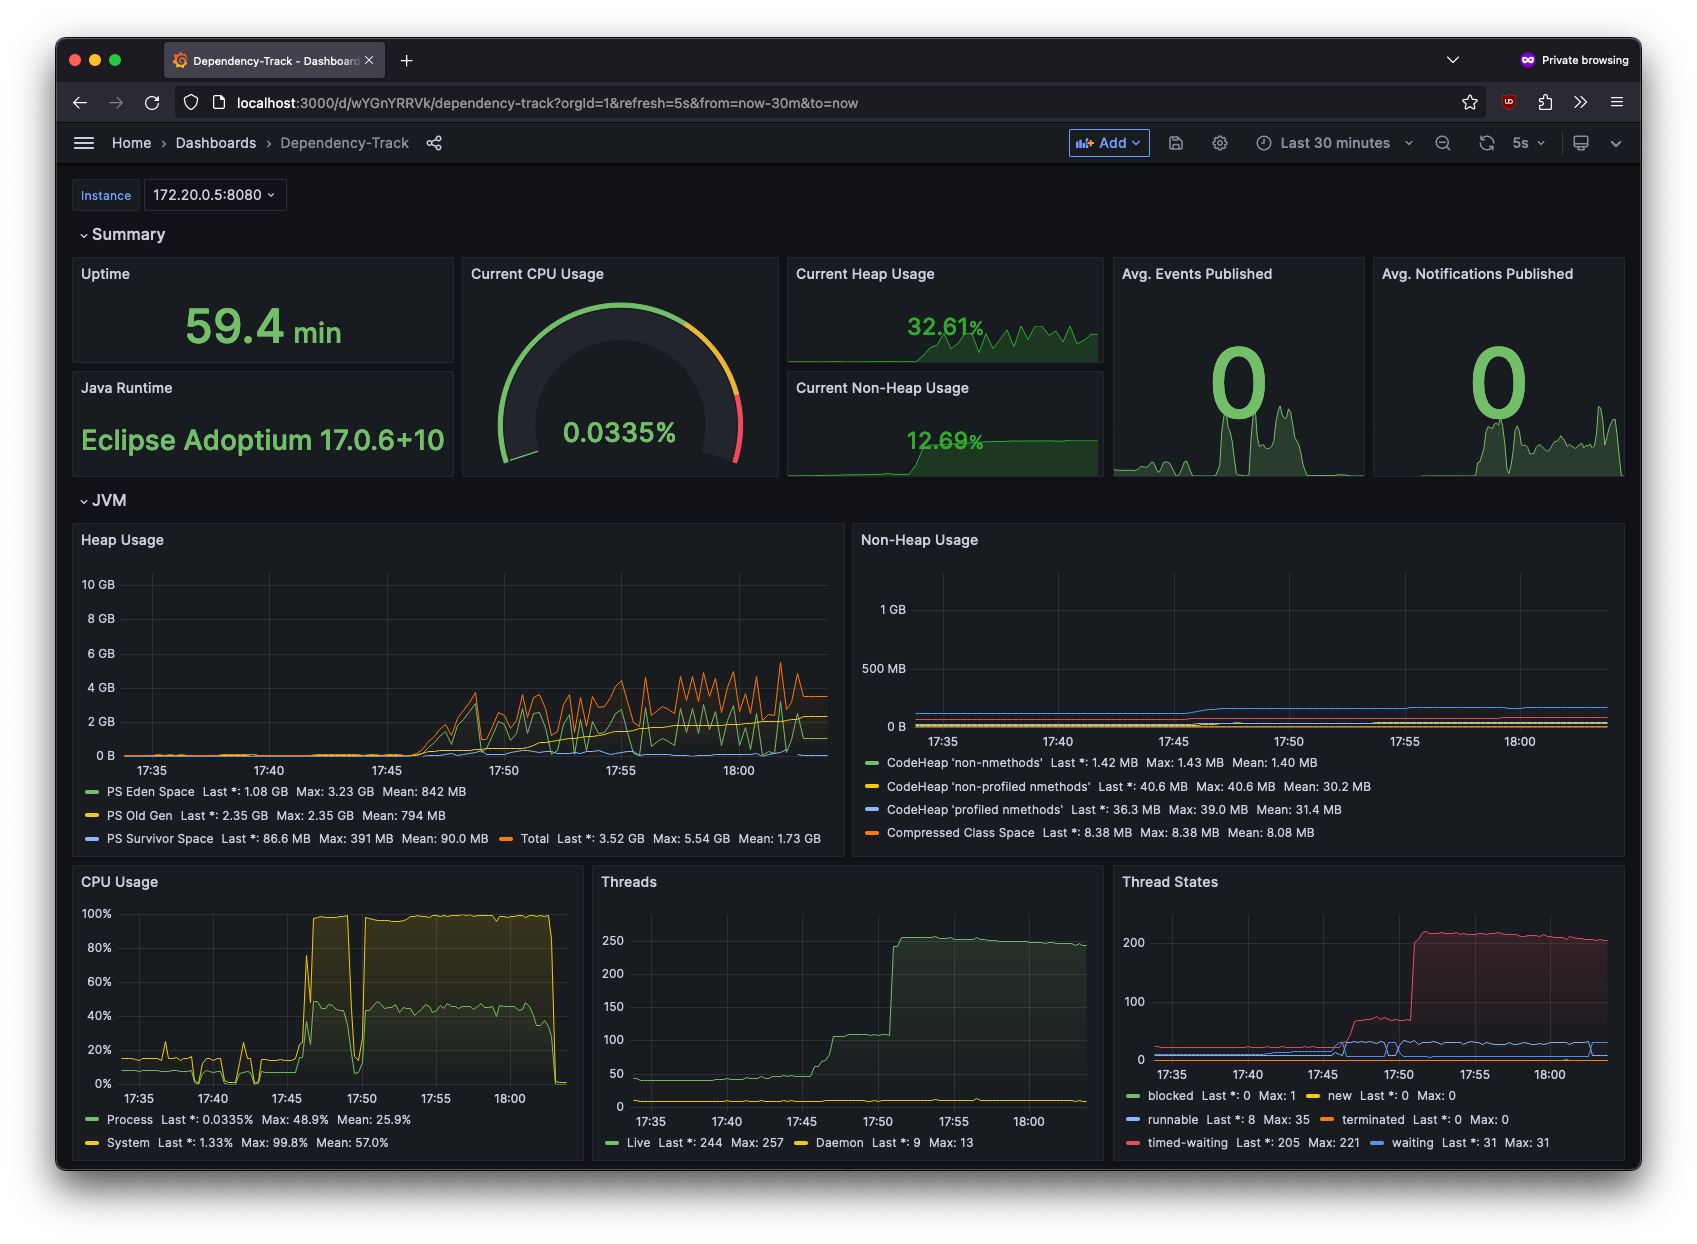
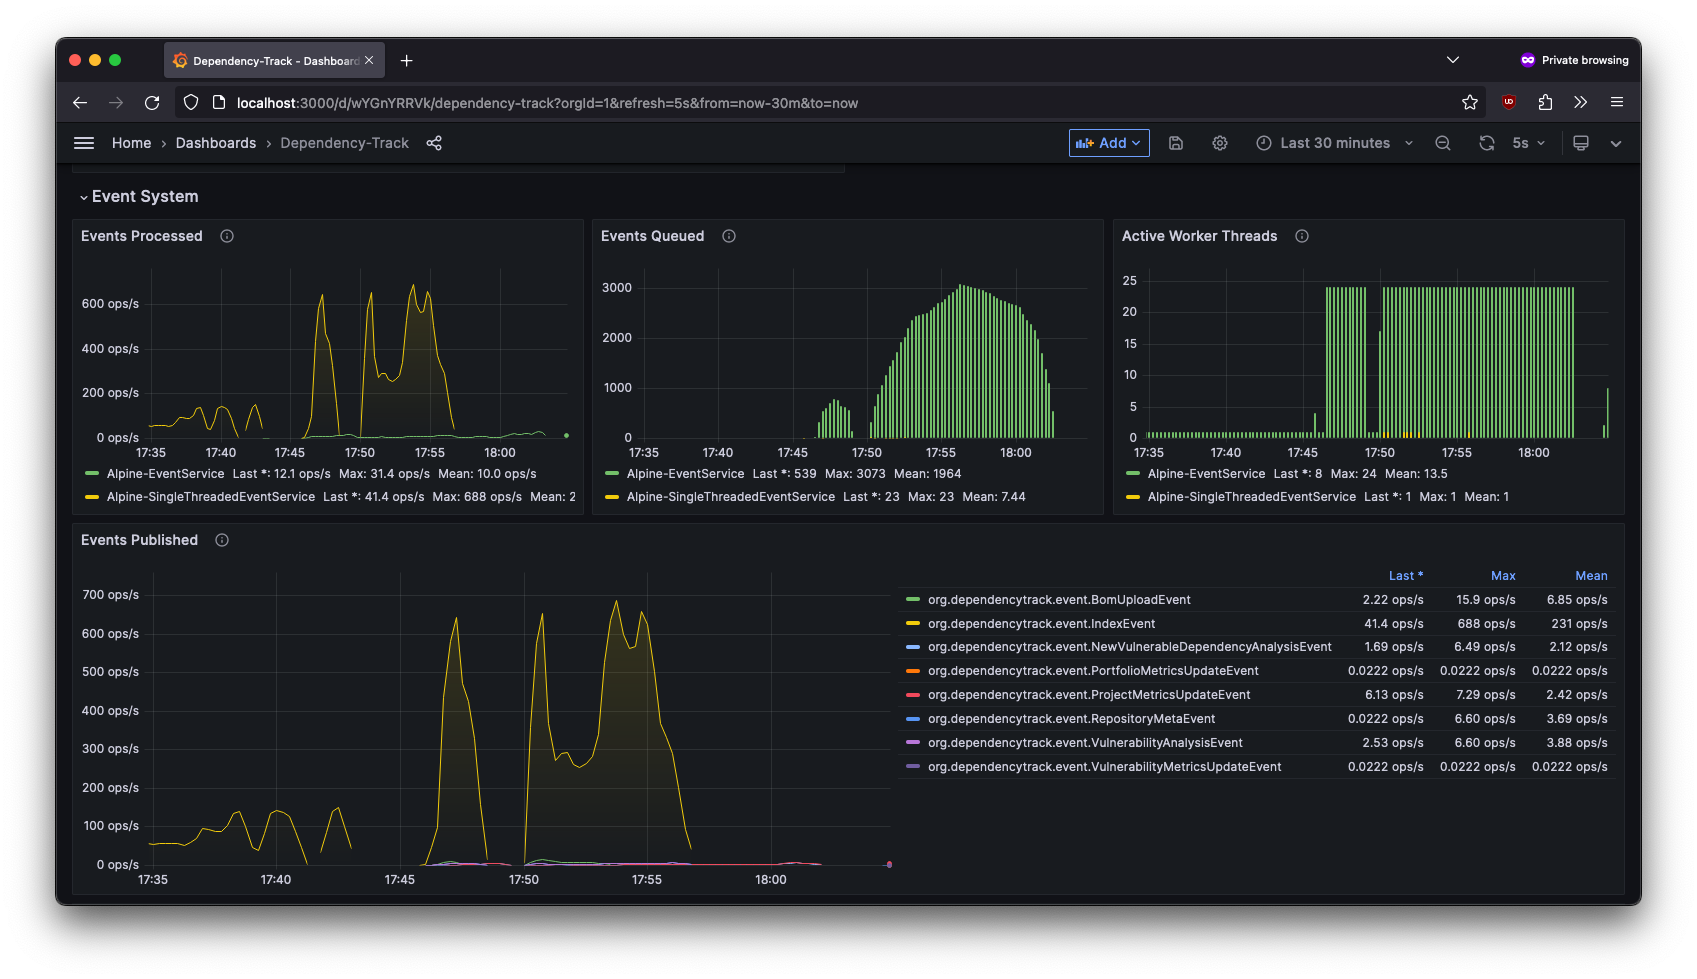
Grafana Dashboard
Because Micrometer is used to collect and expose metrics, common Grafana dashboards for Micrometer should just work.
An example dashboard is provided as a quickstart. Refer to the Grafana documentation for instructions on how to import it.
The example dashboard is meant to be a starting point. Users are strongly encouraged to explore the available metrics and build their own dashboards, tailored to their needs. The sample dashboard is not actively maintained by the project team, however community contributions are more than welcome.